# Chrome 性能分析
# LightHouse
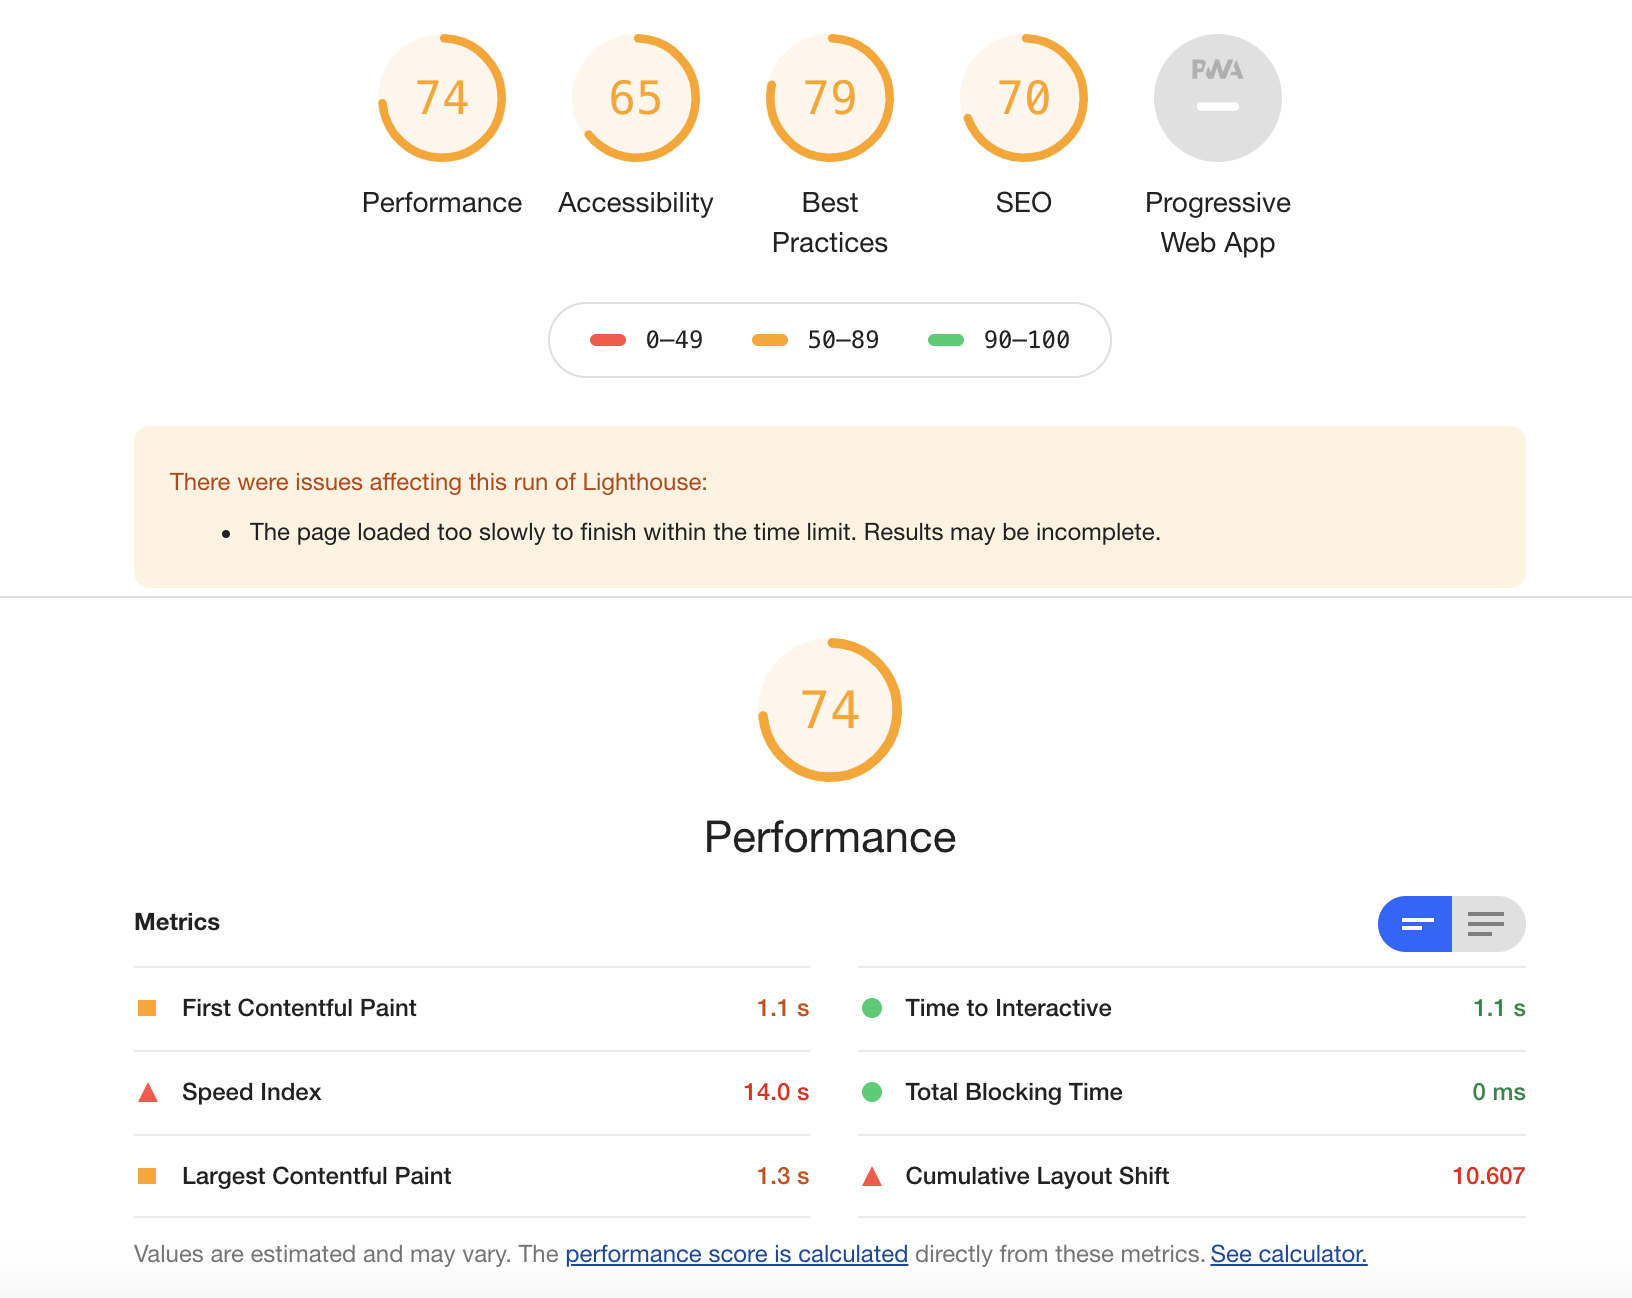
LightHouse 是 Chrome 的一个插件,打开面板发现一个 Lifhhouse 的项,点击 Generate report 会给我们生成性能报告,并提出一些能够优化的建议,如下:
# PageSpeed
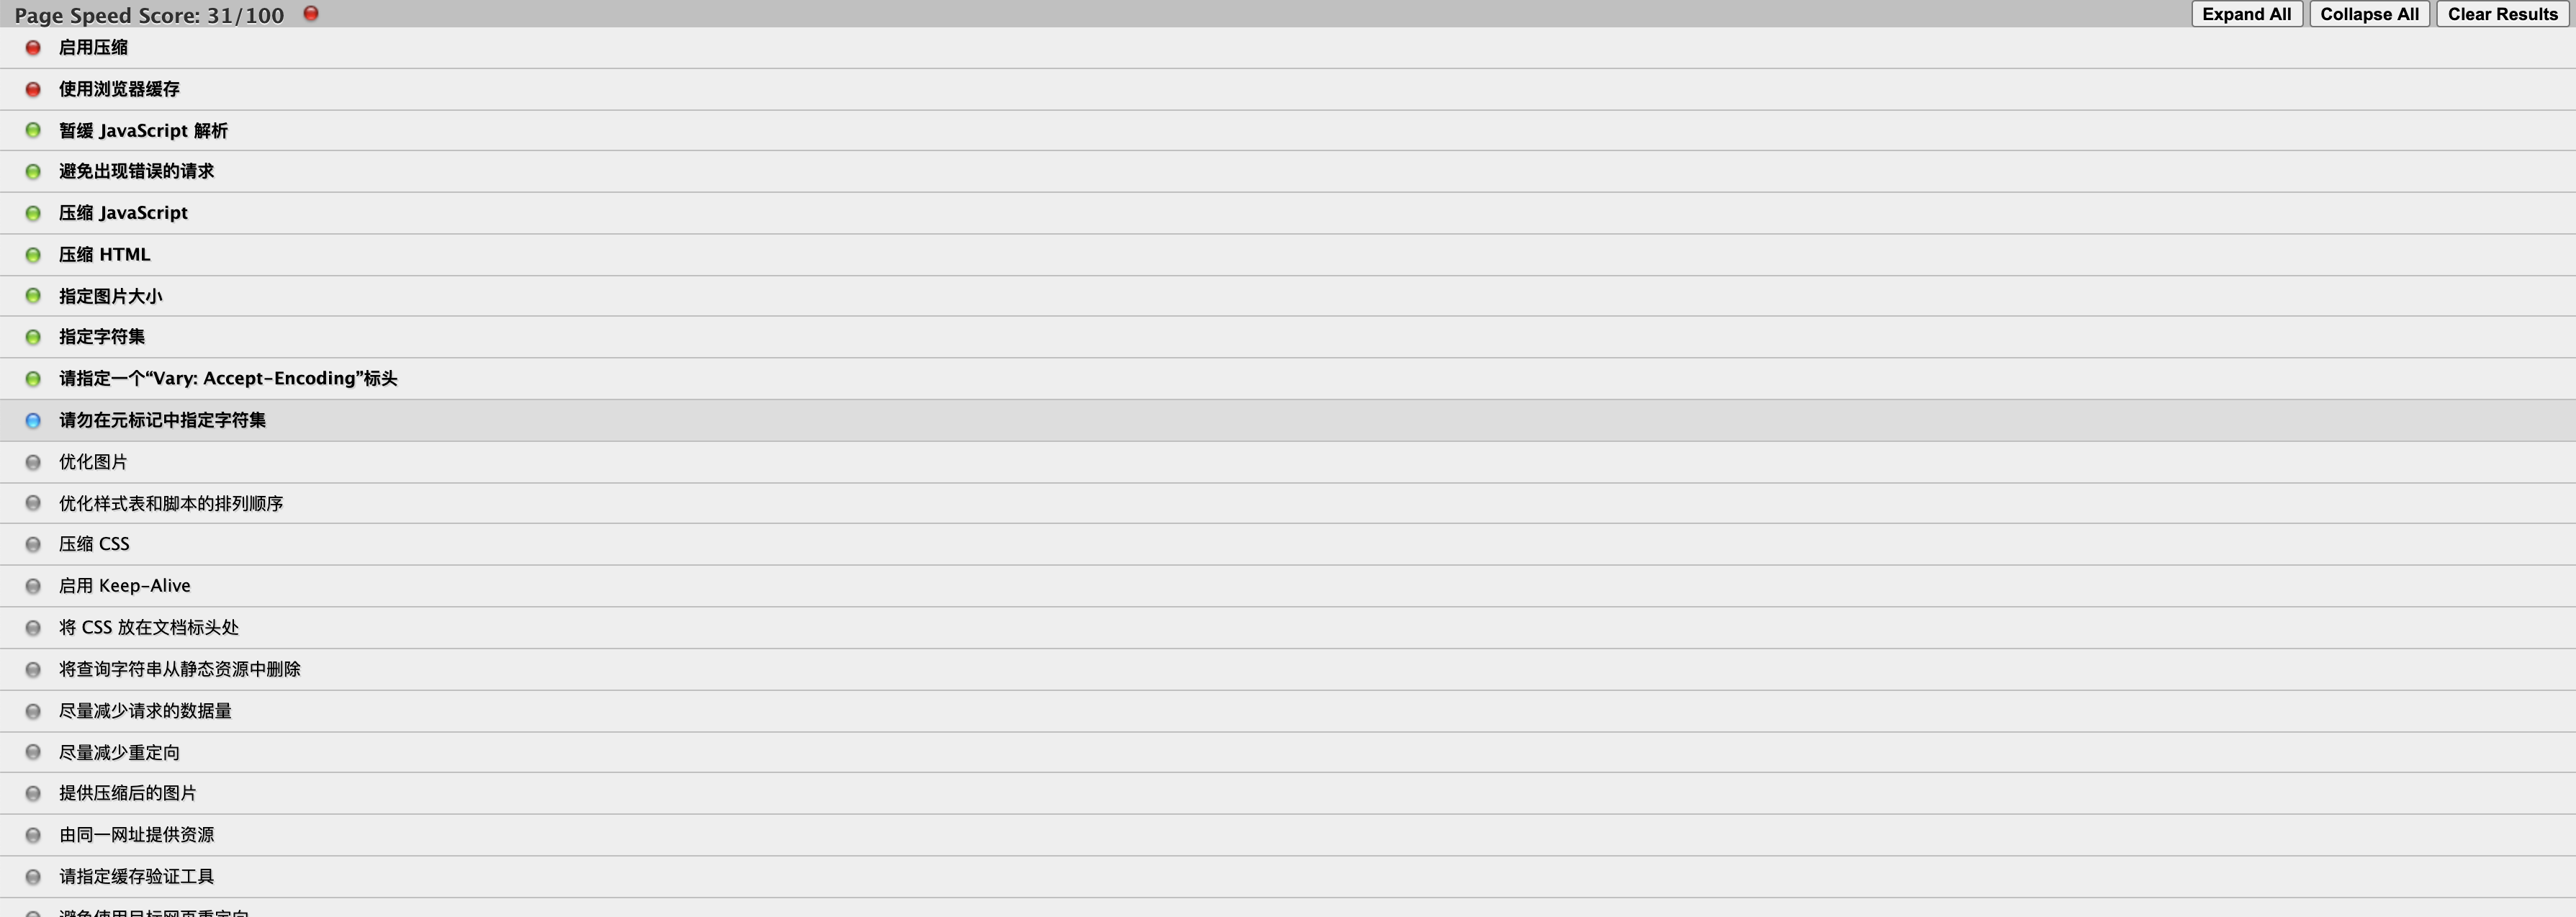
去 Chrome 搜索 pagespeed 选择 PageSpeed Insights (with PNaCl) 添加至 Chrome 即可
打开控制面板会发现新加一个 PageSpeed 的项,点击 START ANALYZING 会列出我们可以优化的点
# WebPageTest
webpagetest (opens new window) 是一款前端性能分析工具,可以在线测试,也可以独立搭建本地服务器. 多测试地点、全面性能报告
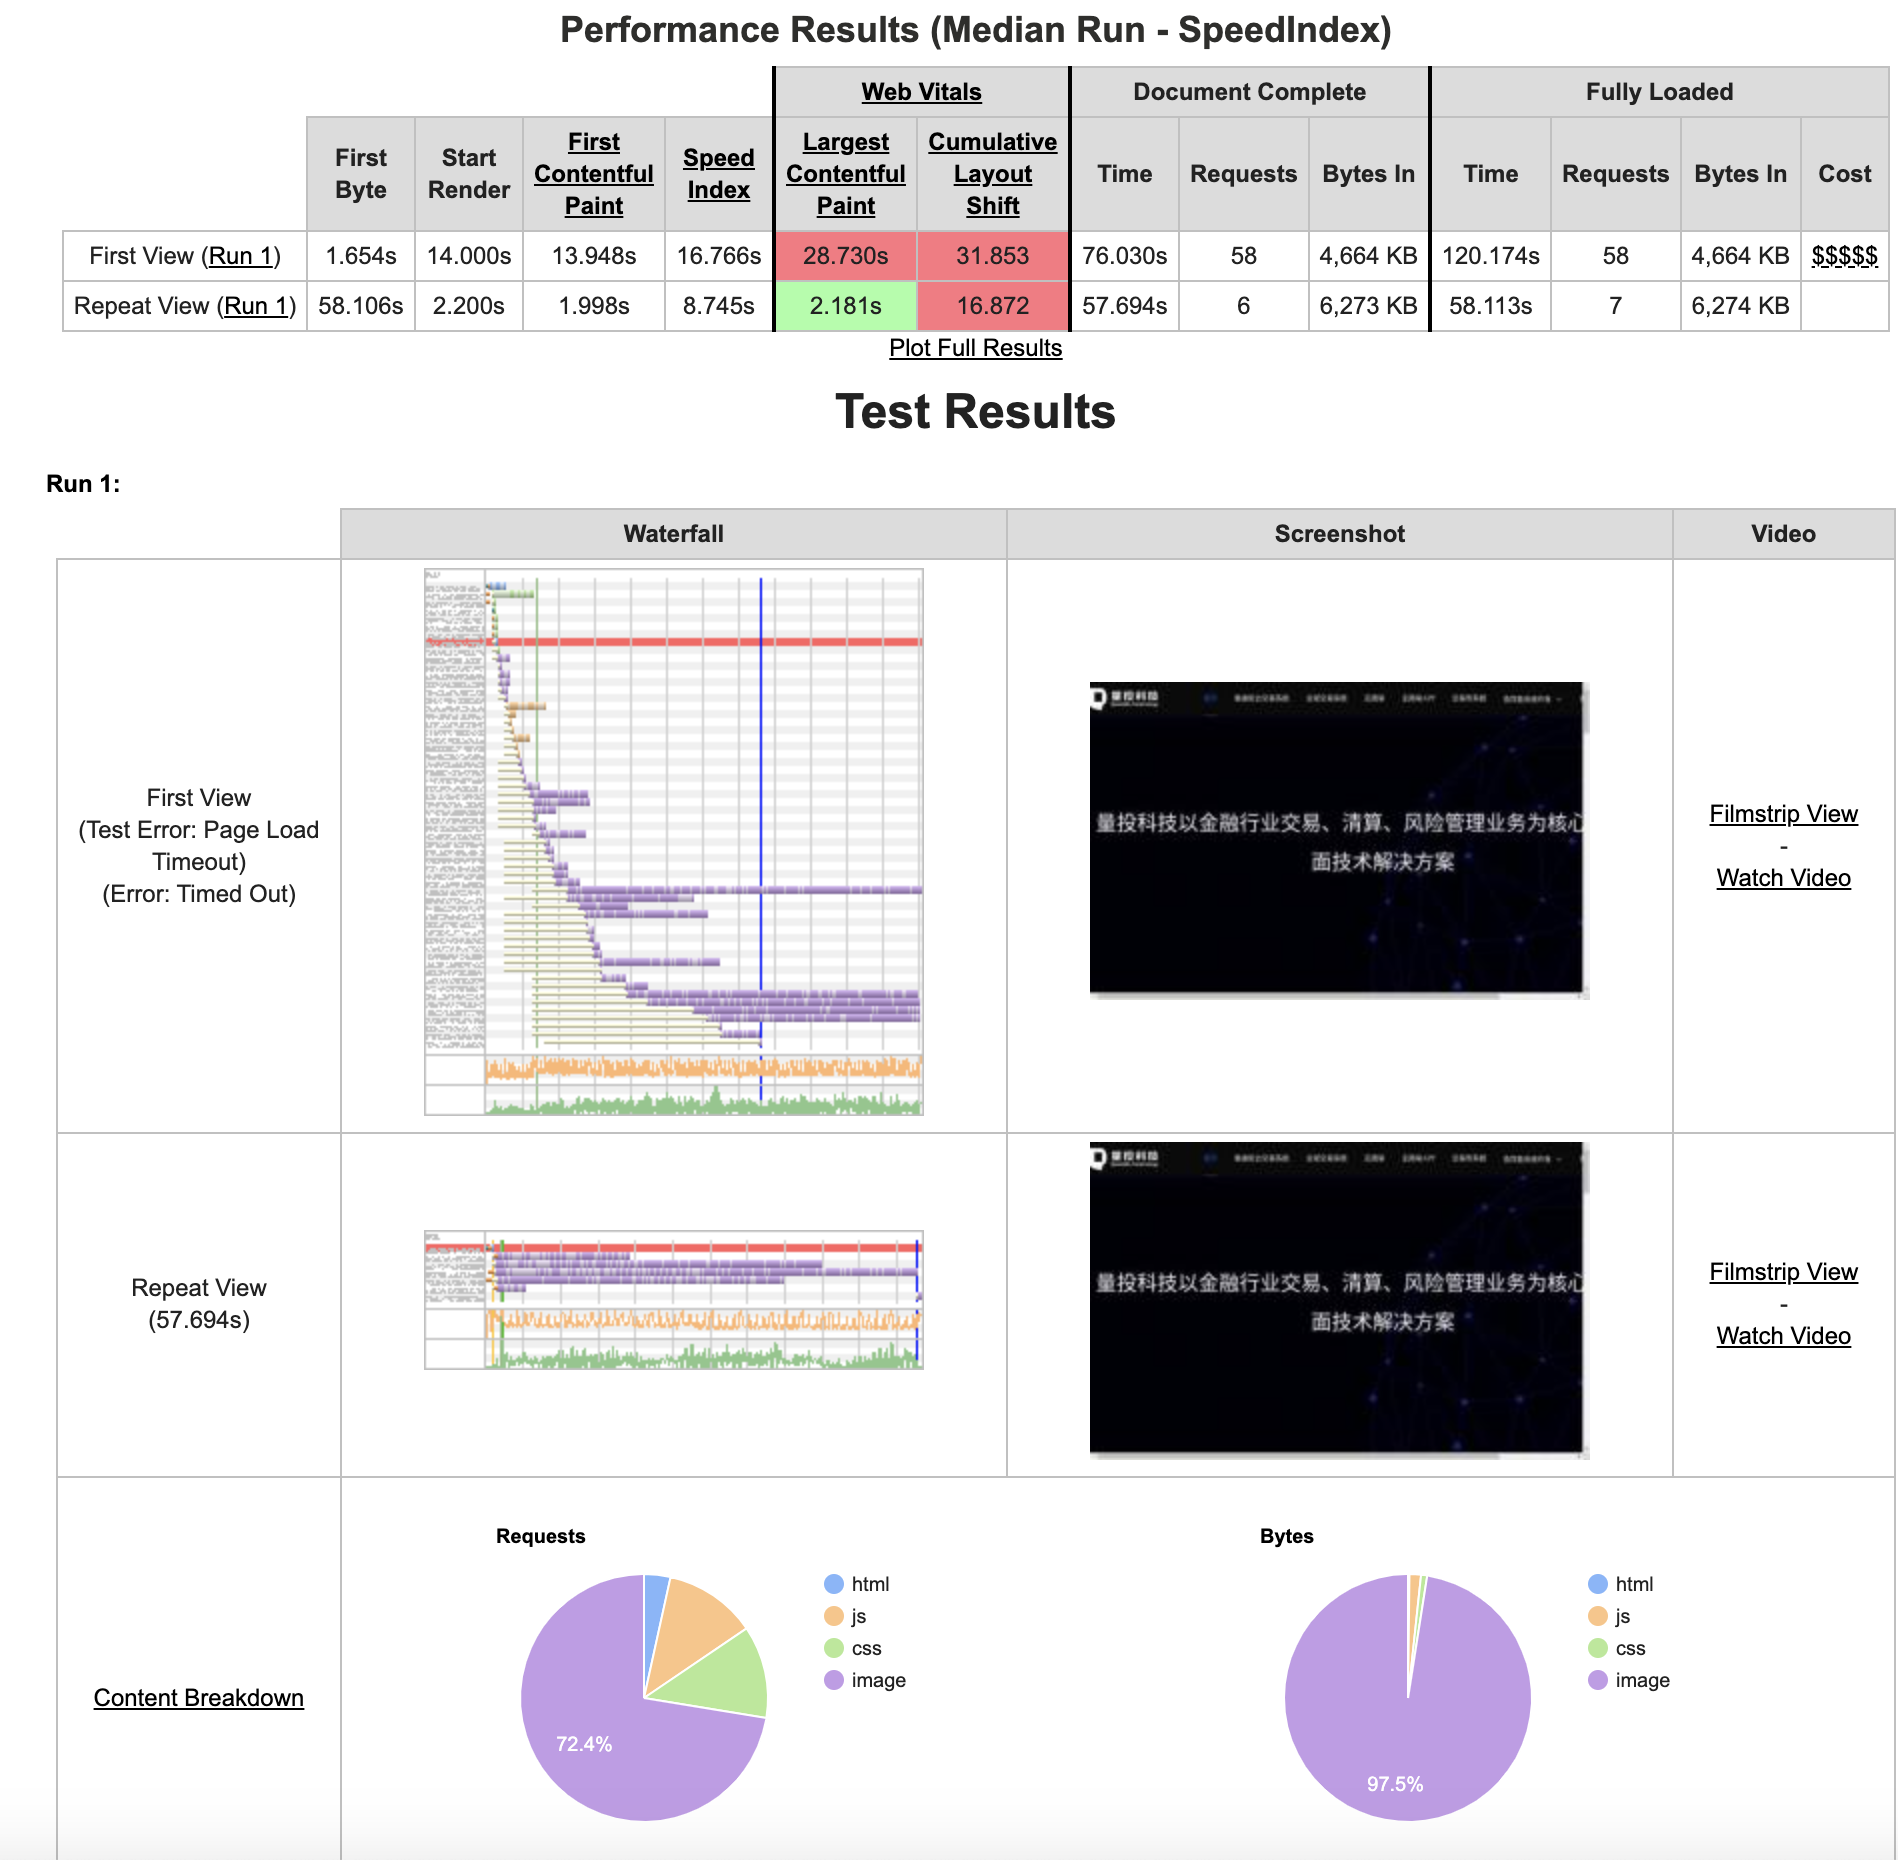
我们可以点开具体报告查看里面每个资源加载的具体时间、文件大小。
# PerformanceObserver
可以利用 PerformanceObserver (opens new window) 来检测性能指标,如下:
<!DOCTYPE html>
<html lang="en">
  <head>
    <meta charset="UTF-8" />
    <meta name="viewport" content="width=device-width, initial-scale=1.0" />
    <title>获取各种指标</title>
    <link
      rel="stylesheet"
      href="https://cdn.staticfile.org/twitter-bootstrap/5.0.0-alpha1/css/bootstrap-reboot.min.css"
    />
  </head>

  <body>
    <div id="app">
      <h1>aotu</h1>
    </div>

    <script>
      const observer = new PerformanceObserver((list) => {
        for (const entry of list.getEntries()) {
          console.log(entry.name);
          console.log(entry.startTime);
          console.log(entry.duration);
          console.log(entry.entryType);
        }
      });
      observer.observe({ entryTypes: ["paint", "resource", "mark"] });
    </script>
    <script>
      performance.mark("xikun");
    </script>
  </body>
</html>
1
2
3
4
5
6
7
8
9
10
11
12
13
14
15
16
17
18
19
20
21
22
23
24
25
26
27
28
29
30
31
32
33
2
3
4
5
6
7
8
9
10
11
12
13
14
15
16
17
18
19
20
21
22
23
24
25
26
27
28
29
30
31
32
33
entryTypes 有如下几种:
| 属性 | 含义 |
|---|---|
| mark | 通过 performance.mark() |
| measure | 通过 performance.measure() |
| resource | 资源时间 |
| frame, navigation | 文件的地址 |
| paint | 获取绘制的时间,主要是 first-paint 和 first-contentful-paint |
| longtask | 在浏览器执行超过 50ms 的任务 |
使用框架 web-vitals
可以通过 npm 安装包使用 也可以直接使用
<script type="module">
  import {
    getCLS,
    getFID,
    getLCP,
  } from "https://unpkg.com/web-vitals@0.2.4/dist/web-vitals.es5.min.js?module";

  getCLS(console.log);
  getFID(console.log);
  getLCP(console.log);
</script>
1
2
3
4
5
6
7
8
9
10
11
2
3
4
5
6
7
8
9
10
11
更多详细移步:web-vitals (opens new window)
# performance.timing
我们可以使用浏览器的 API performance.timing 详细的记录 TCP 连接,DOM 解析,白屏 等时间
<script>
  let t = performance.timing;

  DNS 解析耗时: domainLookupEnd - domainLookupStart
  TCP 连接耗时: connectEnd - connectStart
  SSL 安全连接耗时: connectEnd - secureConnectionStart
  网络请求耗时 (TTFB): responseStart - requestStart
  数据传输耗时: responseEnd - responseStart
  DOM 解析耗时: domInteractive - responseEnd
  资源加载耗时: loadEventStart - domContentLoadedEventEnd
  First Byte时间: responseStart - domainLookupStart
  白屏时间: responseEnd - fetchStart
  首次可交互时间: domInteractive - fetchStart
  DOM Ready 时间: domContentLoadEventEnd - fetchStart
  页面完全加载时间: loadEventStart - fetchStart
  http 头部大小: transferSize - encodedBodySize
  重定向次数:performance.navigation.redirectCount
  重定向耗时: redirectEnd - redirectStart

  if ((t = performance.memory)) {
    console.log('js内存使用占比 :' +((t.usedJSHeapSize / t.totalJSHeapSize) * 100).toFixed(2) + '%');
  }
</script>
1
2
3
4
5
6
7
8
9
10
11
12
13
14
15
16
17
18
19
20
21
22
23
2
3
4
5
6
7
8
9
10
11
12
13
14
15
16
17
18
19
20
21
22
23